FAR vs FRR vs APCER vs BPCER: Compliance Guide
Author: Carter H | 20 Jul 2026In This Post
One impressive accuracy figure can hide several very different biometric failures. A system may reject a genuine customer, accept an impostor, or allow a spoof to pass, yet each outcome is measured differently. For compliance teams, knowing which metric describes which failure is essential before relying on a vendor’s headline result.
The pressure is growing. A 2025 European Parliamentary Research Service briefing reported that a deepfake attack occurred every 5 minutes in 2024, and that 49% of companies experienced audio or video deepfakes. As remote onboarding expands, matching accuracy alone no longer shows whether a biometric control can withstand presentation attacks.
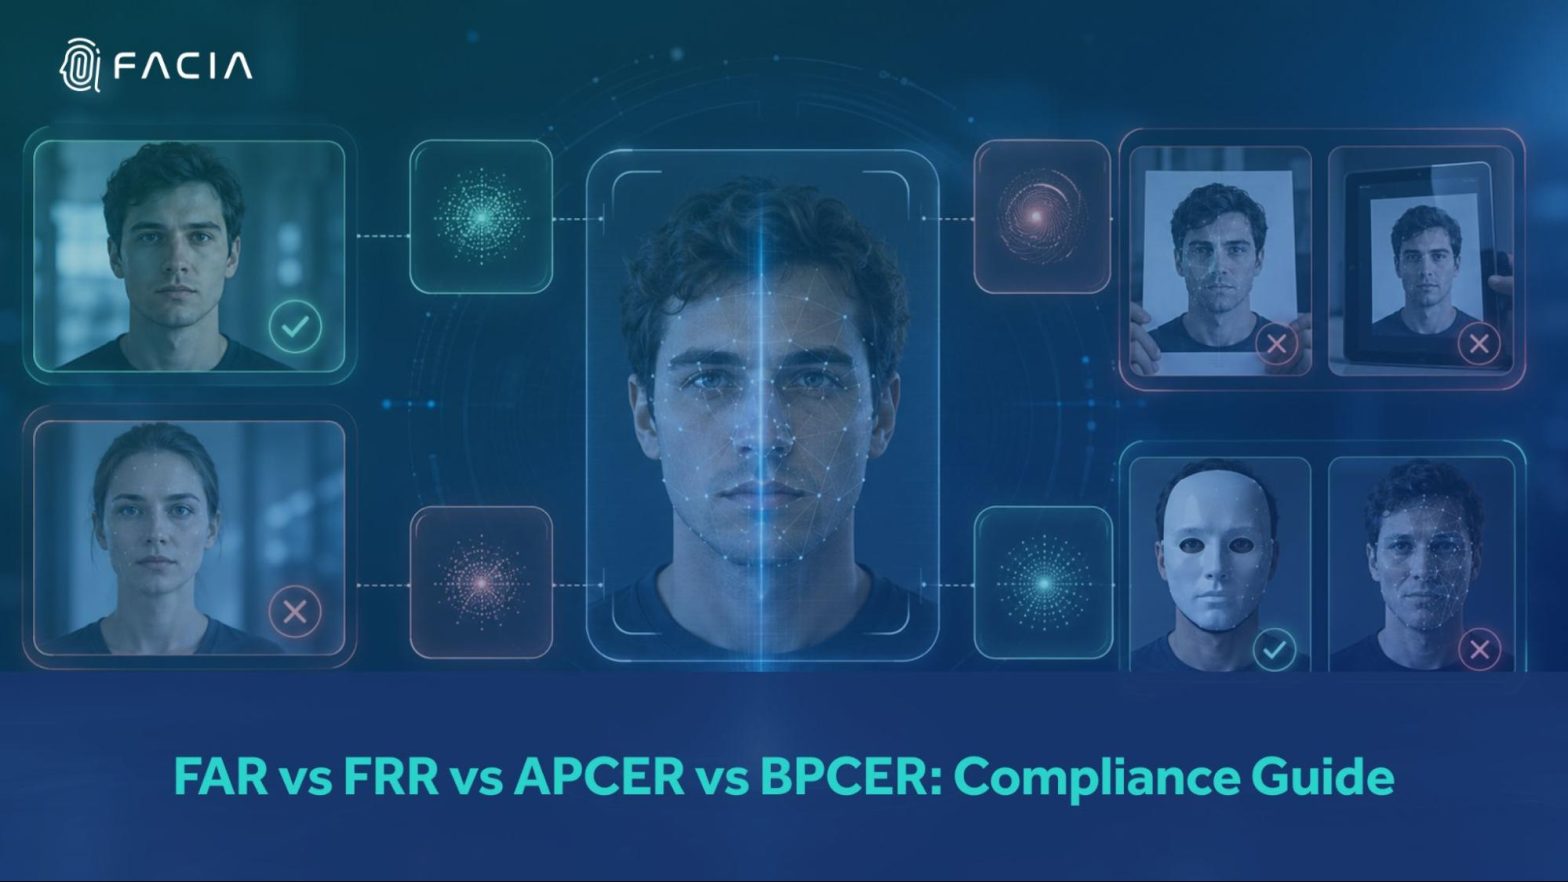
FAR, FRR, APCER, and BPCER help separate these risks. Two measures face matching decisions, and two measure presentation attack detection.
This guide compares all four, explains the trade-offs between them, and shows what compliance teams should examine when reviewing test results, operating thresholds, and vendor evidence before deployment in live environments.
Two Stages, Four Different Errors
Typical biometric verification processes include two decisions.
The first question is whether the person appears to be the same as the claimed identity. This is the matching phase of the face matching, where FAR and FRR are used.
The second question is whether or not the face shown to the system is real. This is the presentation attack detection (PAD) phase, where APCER and BPCER are applicable.
Presentation attack detection errors are measured by Two Stages, Four Errors: APCER, BPCER; Face-matching errors are measured by: FAR, FRR.
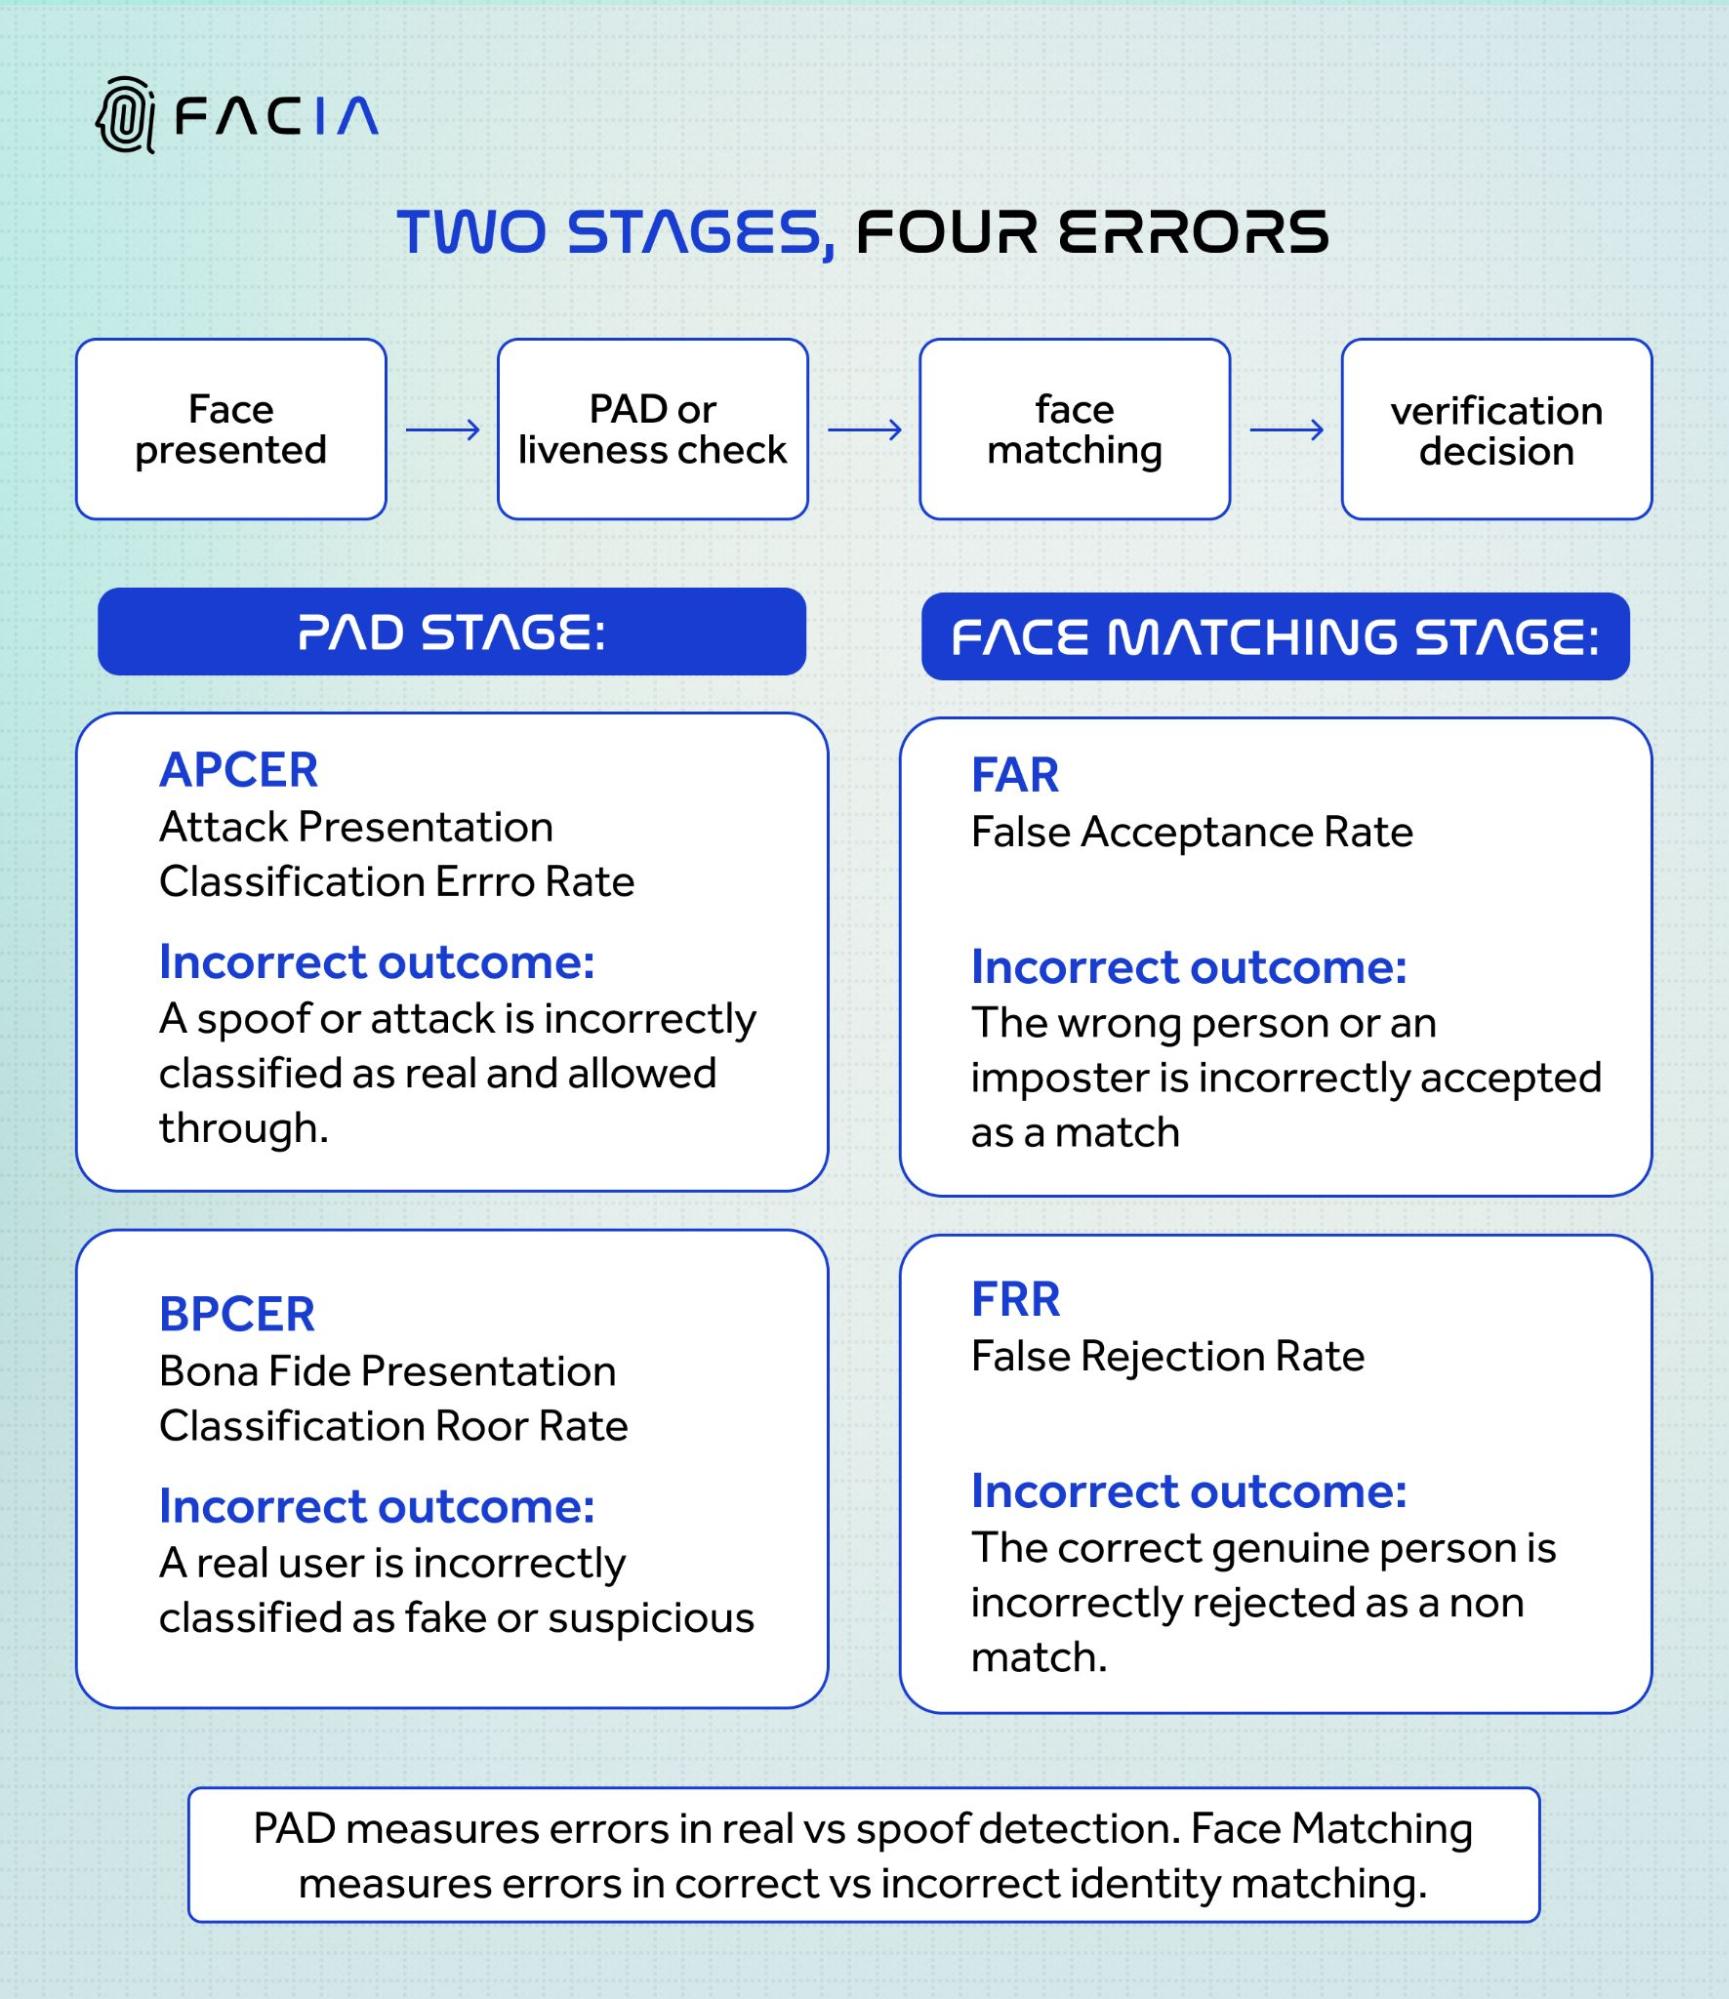
This is important because good performance at one stage does not necessarily translate into good performance at the other. A system can be able to accurately match faces, but not against replay attacks or synthetic media. The other may catch out spoofs, but block too many genuine users.
FAR vs FRR: Security and User Access
The False Acceptance Rate (or FAR) is the rate at which an unauthorized person is accepted as an authorized person. In the compliance arena, FAR addresses impersonation, account takeover, and unauthorized access. A lower FAR typically results in fewer false approvals for the conditions tested.
The False Rejection Rate (FRR) is the percentage of correctly identified users who are incorrectly rejected.
A high FRR can lead to more serious attempts to abandon, more checks, more customer support requests, and more manual reviews. It could also raise concerns about accessibility and equity if some users have a harder time verifying their identity.
FAR and FRR should be interpreted in conjunction with each other. Lowering the false acceptance rate will also increase the false rejection rate. Making it more relaxed will make it easier for real users to access it, but harder for security breaches to occur.
A 2025 Benchmark for Context
The 10,000:1 false-match rate and better, and the 100:1 false-non-match rate, for one-to-one biometric verification, are the NIST SP 800-63A-4 requirements. It also states that the performance of a demographic group should not exceed differences of 25% from the overall performance
These numbers are good references, but not targets for any biometric deployment. The threshold will vary depending on the riskiness of the transaction, the user journey, and the consequences of making the wrong decision.
APCER vs BPCER: Spoof Detection and Customer Friction
APCER is the percentage of attack presentations that are misclassified as a genuine presentation.
An attack may be a printed photograph, a replayed video, a mask, or any other object used to fool a PAD system. Low APCER only demonstrates performance against the attack types and conditions included in the test.
Bona Fide Presentation Classification Error Rate (BPCER): The percentage of false attacks that are classified as a bona fide presentation.For an actual customer, that mistake could look like a failed liveness check, re-prompting for capture or being referred to manual review. The results may vary depending on lighting, movement, camera quality, and the system’s sensitivity.
APCER–BPCER is a conflictual relationship. There might be more false alarms with a more sensitive PAD, which may prevent more attacks but alert more users. So, compliance teams need to request the same threshold for both numbers.
This standard, ISO/IEC 30107-3:2023, establishes procedures for evaluating PAD performance, reporting results, and classifying known attack types. It’s a good starting point to determine whether a vendor’s testing is limited to a few simple tests.
FAR, FRR, APCER and BPCER Compared
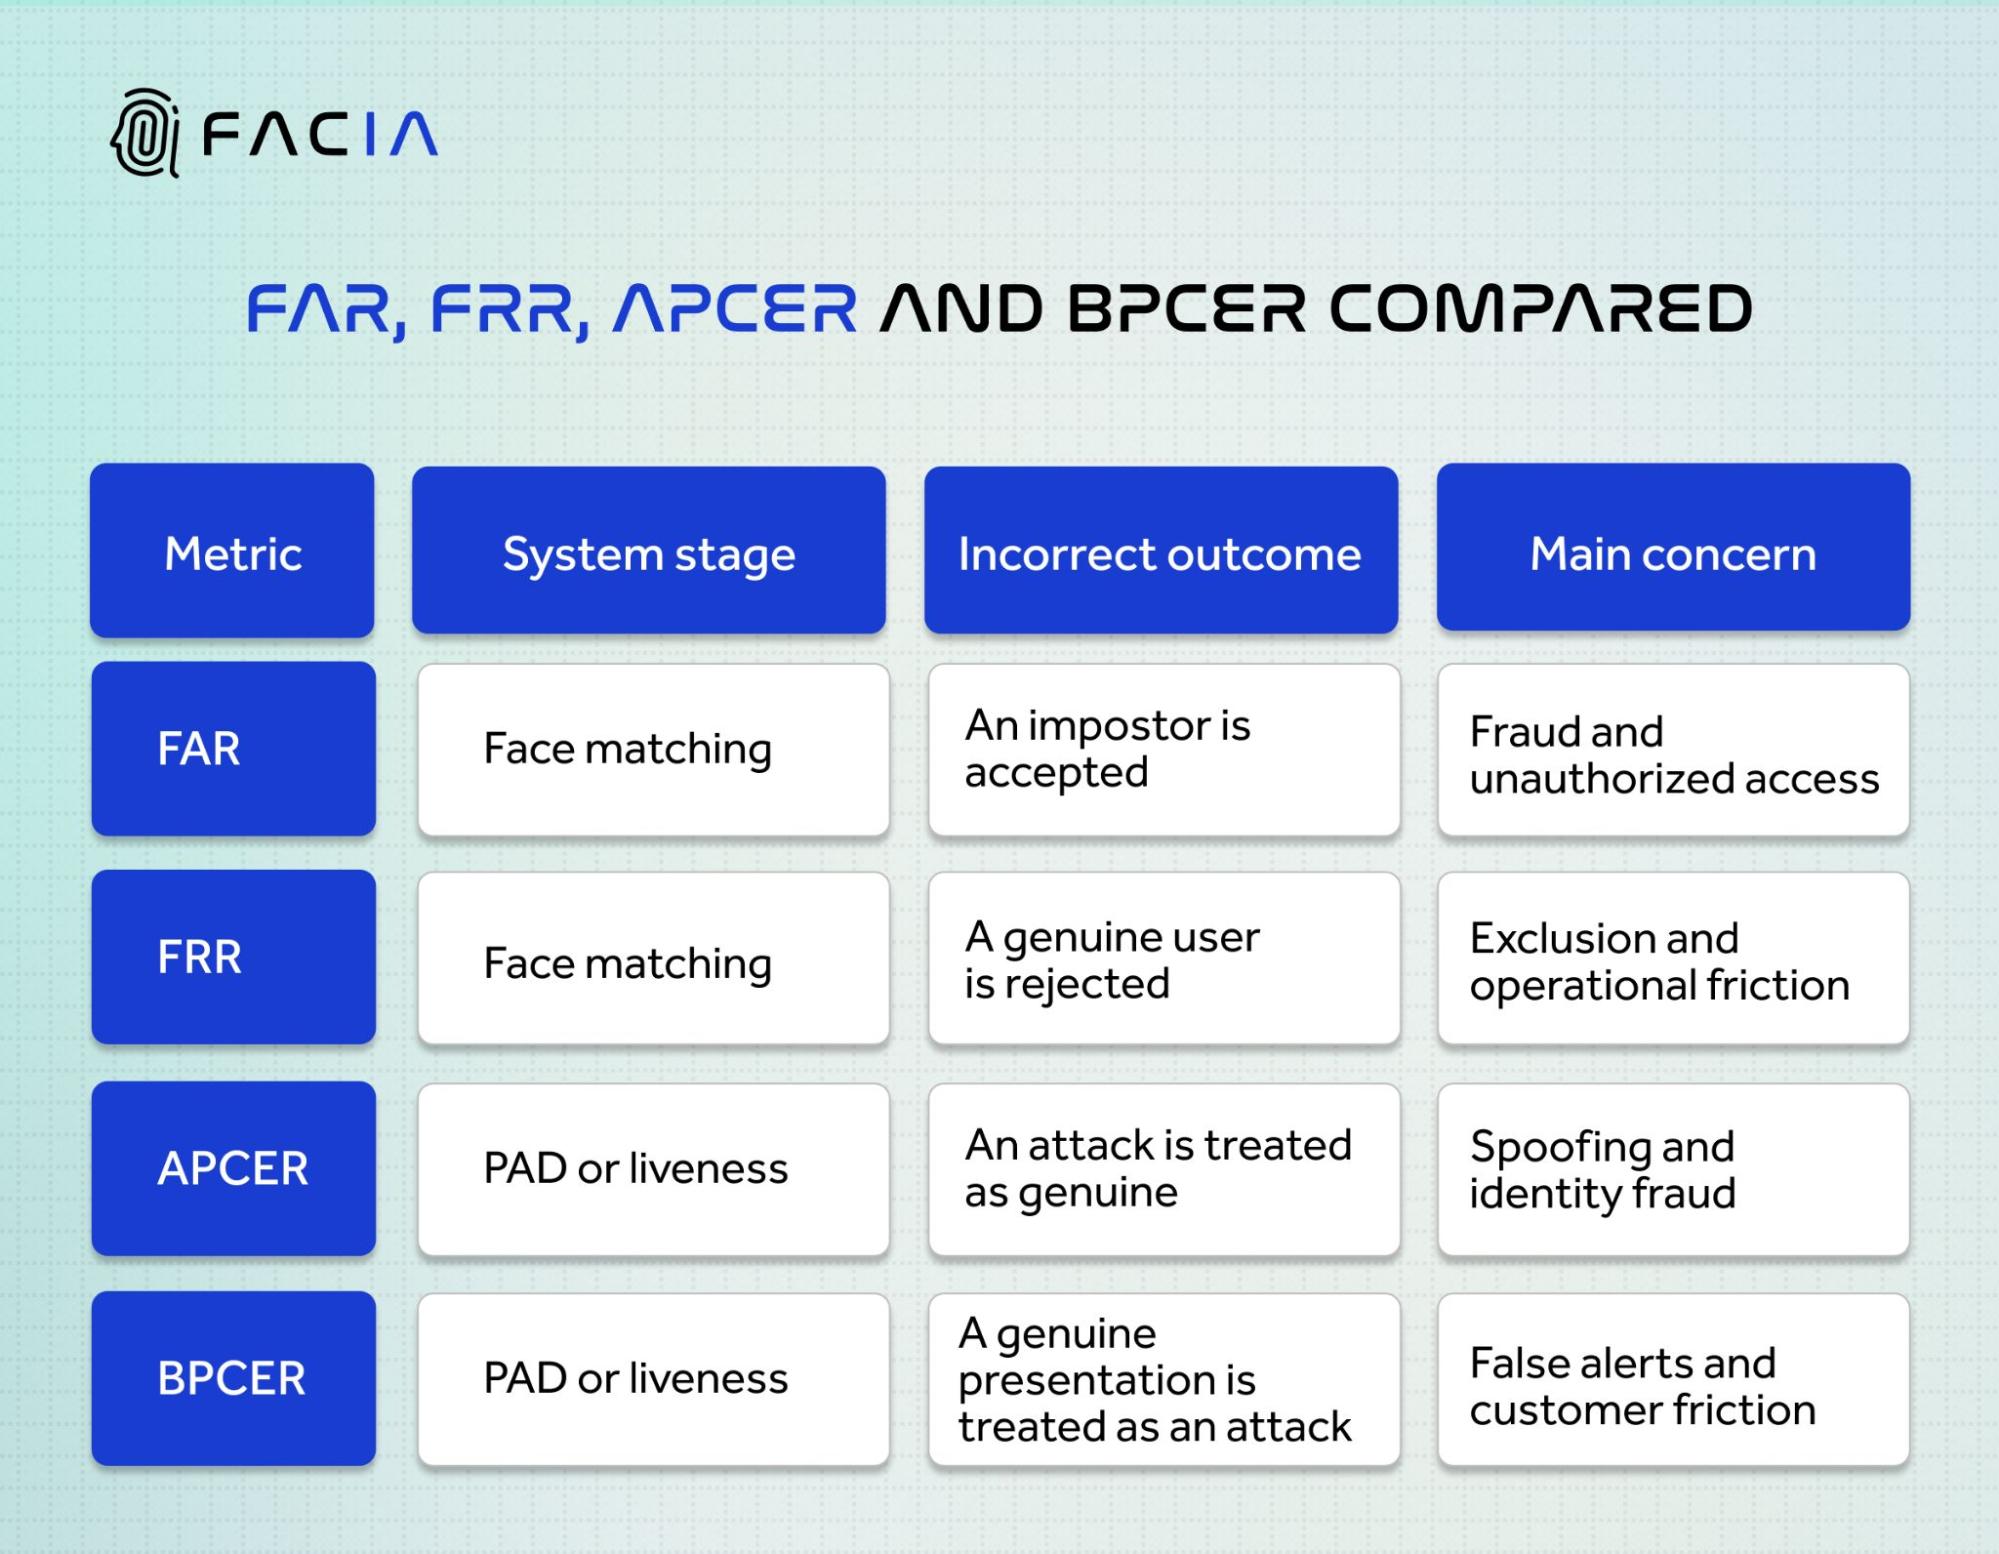
The key is to compare the right pairs. FAR belongs with FRR. APCER belongs with BPCER. All four are needed to understand the full verification journey.
Why Headline Error Rates Need Context
A performance figure is only meaningful when the test conditions are clear.
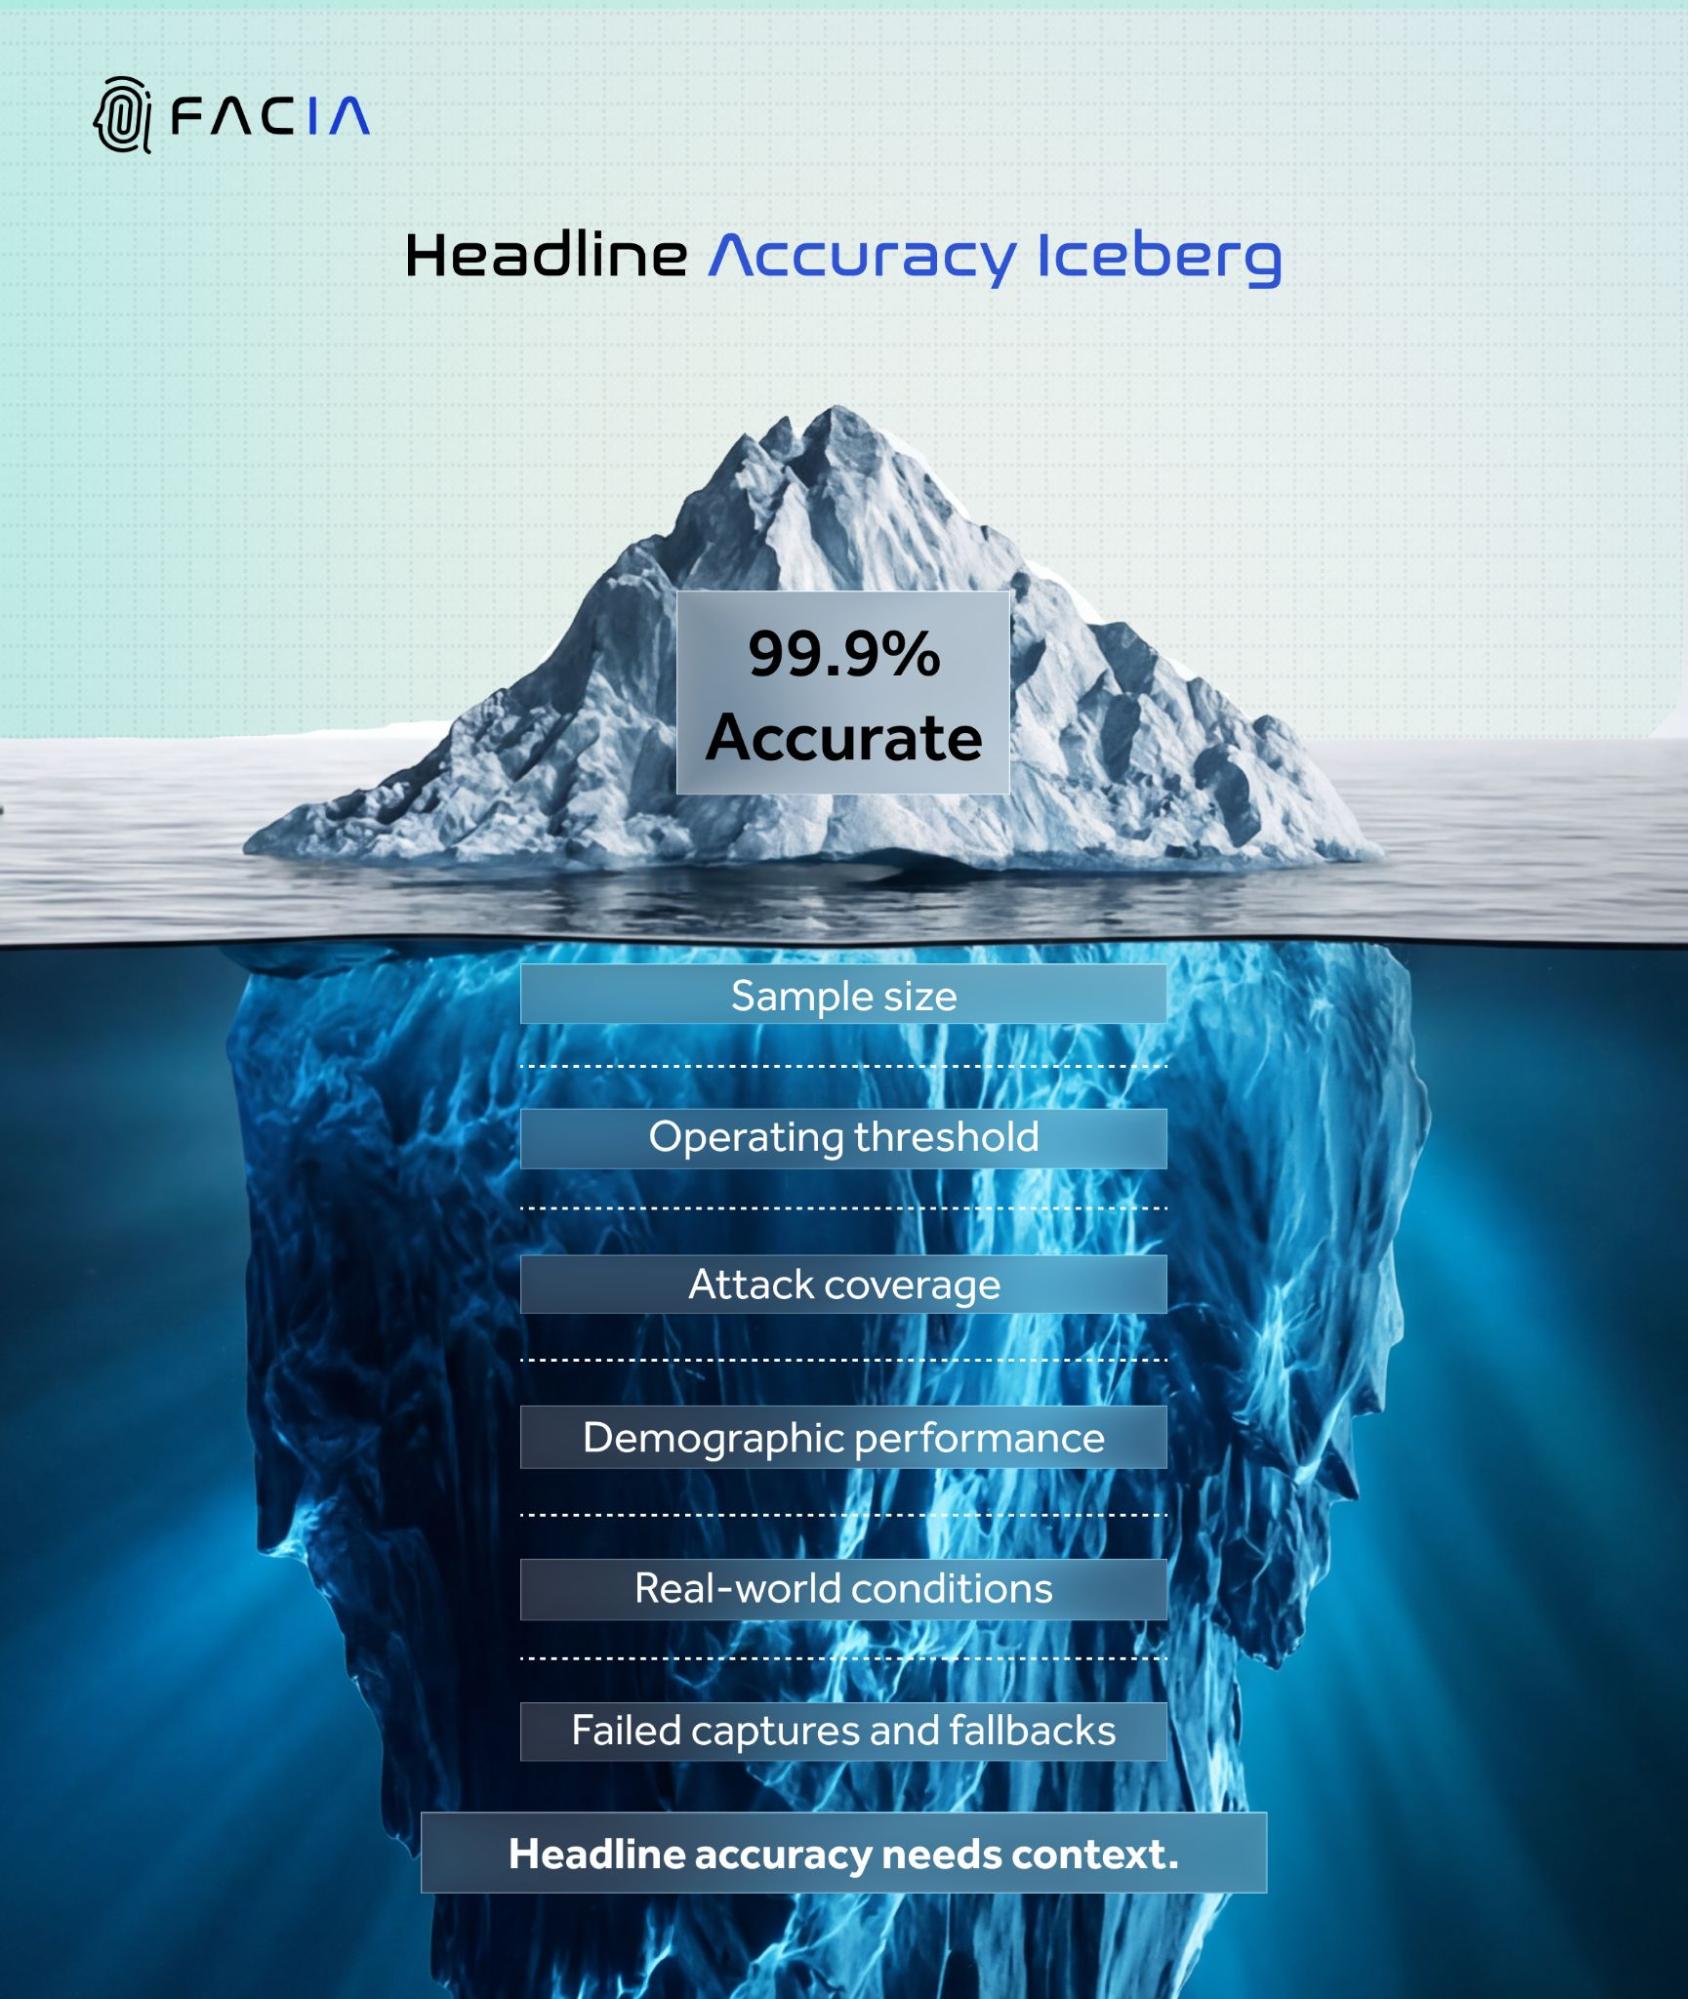
Headline accuracy may be misleading in two ways: it might show only part of the evidence that is required for compliance, or it might show evidence that is accurate but not relevant to compliance.
-
Sample Size
If there are no errors in the test, it doesn’t mean that there is no risk. It simply indicates that there was no error in that sample.
-
Operating Threshold
Do you ask whether the published results were obtained at the same threshold as the one set for deployment? The ratio of security to legitimate user access can vary according to the setting.
-
Attack Coverage
The attacks included in testing should be identified in an APCER result. A successful attack on printed photos does not necessarily mean a successful attack on masks, replay attacks, deepfakes, or digital injection.
-
Real-World Conditions
The laboratory and production environments are not the same. Performance may be influenced by factors such as devices, lighting, camera quality, network connections, and user activity.
-
Demographic Results
Average performance can mask under-performing results at a school level. Compliance teams should request breakdowns of the data and question the vendor about how it tested for meaningful differences in its target customer base.
-
Failed Captures and Fallbacks
It is also important that teams look at the reporting of failures and non-responses. There should be a safe path for real users when an automated check cannot be completed.
Questions Compliance Teams Should Ask Vendors
Before relying on a biometric performance claim, ask:
- Which part of the system does the metric measure?
- What paired metric was recorded at the same threshold?
- What sample size and population were used?
- Which attacks, devices, and environments were tested?
- Was demographic performance assessed?
- Was the evaluation carried out independently?
- Were failed captures and non-responses included?
- What happens when a genuine user cannot complete verification?
These questions turn technical percentages into evidence that can support procurement, risk assessment, and ongoing vendor oversight.
Biometric Compliance and Performance with Facia
FAR, FRR, APCER, and BPCER are not four versions of the same accuracy score. FAR and FRR measure face matching errors. APCER and BPCER measure presentation attack detection errors.
A sound assessment considers the paired rates, operating threshold, attack coverage, test population, deployment conditions, and fallback available to genuine users.
Facia combines facial recognition with liveness detection system so organizations can assess both sides of the biometric decision: whether the person matches the claimed identity and whether the presentation itself can be trusted.
That broader view gives compliance teams a firmer basis for balancing fraud prevention, customer access, and evidence requirements.
Talk to Facia’s team about the biometric performance and anti-spoofing requirements of your identity verification process.